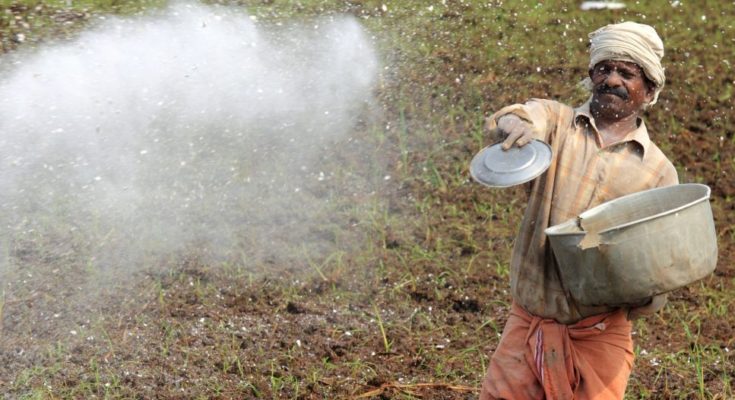
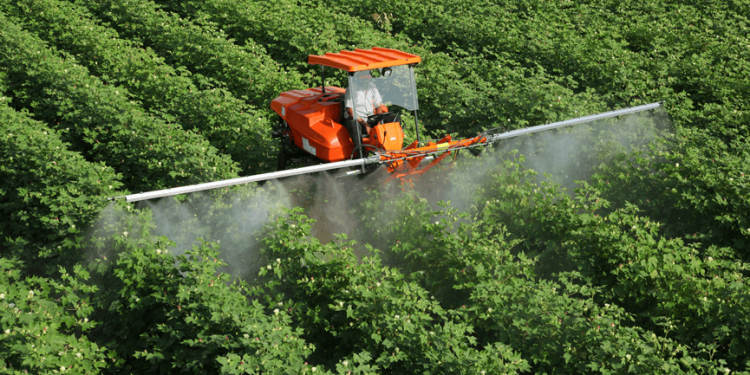
Data shared by the government recently indicates that the consumption of chemical fertilizers has increased by around 16% between 2015-16 & 2020-21. From about 510 LMT in 2015-16, the consumption increased to 590 LMT as per provisional figures for 2020-21. Even the consumption of chemical pesticides has increased during this period.
Recently, fertilizer manufacturers in India including the Indian Farmers Fertilizers Cooperative Ltd. (IFFCO) announced a steep hike in the price of agricultural inputs such as di-ammonium phosphate (DAP) as a result of increased prices of raw materials in the international market. In the past few months, the prices of potash, DAP, phosphoric acid, etc. have also increased significantly forcing the fertilizer makers to hike the prices of the de-controlled nutrients.

However, the Minister of State for Chemical and Fertilisers, Mansukh Mandaviya announced that the manufacturers have been asked not to increase the prices of all fertilizers. IFFCO has also clarified that there is enough material with old rates which will be sold at the old rates to farmers. Further, IFFCO has stated that the new prices are only tentative and yet to be finalized by companies.
Multiple factors determine fertilizer usage
Consumption of fertilizers and pesticides is determined by multiple factors such as area of land under cultivation, the type of crop, cropping pattern and cropping intensity, soil type and its condition, agro-climatic conditions, the ability of farmers to purchase, irrigation, and others.
The Department of Agriculture & Co-operation and farmers Welfare also carries out assessments to determine the requirement of chemical fertilizers- Urea (Nitrogen), DAP, MOP (Muriate of Potash), and NPKs (contains major nutrients- Nitrogen, Phosphorous, and Potassium) on a season-to-season basis, taking into consideration the above-mentioned factors and finalizes the requirement of for each season in consultation with the states. Bi-annual zonal conferences are held before the beginning of each cropping season i.e., Kharif (April to September) and Rabi (October to March). The allocation of fertilizers to states is an outcome of this process.
Urea is the most consumed fertilizer
On average, India consumed about 500 LMT of fertilizer per year in the last 10 years. The government recently provided year-wise consumption data in the Rajya Sabha, showing the trend in the quantity of chemical fertilizers used in India since 2015-16. As per the data shared, Urea is the most consumed fertilizer with around 300 Lakh Metric Tonnes (LMT) being consumed each year, accounting for 55 to 60% of the chemical fertilizer consumption in the country. Between 2016-17 and 2019-20, there has been a steady increase in the consumption of Urea, DAP, and NPKs. The data for 2020-21 is provisional and is available up to February 2021.
Even though the data is only up to February 2021, the consumption of DAP and NPKs is already the highest in 2020-21 in the six-year period from 2015-16 to 2020-21. The final quantity of urea consumed in 2020-21 might also cross the 2019-20 levels making the consumption highest in 2020-21.
Maharashtra and UP top the list of pesticide consumption in the last five years
The consumption of chemical pesticides has also been on a rise in India. Between 2015-16 and 2019-20, there has been a growth of 8.78% in the overall consumption of pesticides in the country, from 56,720 metric tonnes (MT) to 61,702 MT. Maharashtra and Uttar Pradesh are the major consumers of chemical pesticides in the country over the last five years.

The consumption in Maharashtra increased from 11,665 MT in 2015-16 to 12,783 MT in 2019-20. The consumption in Uttar Pradesh had also increased from 10,457 MT to 12,217 MT during the same period. Together, the two states accounted for 40% of the total consumption reported at the national level. Punjab had the third-highest consumption with an average of 5,592 MT consumed every year. UP and Telangana reported a steady increase in pesticide consumption in contrast to Andhra Pradesh, where the pesticide consumption has decreased by almost 40% in these five years.
The lowest usage of pesticides was in the small states. Goa had the least consumption with 30 MT in 2019-20 as compared to 48 MT in 2015-16. Puducherry too had low consumption with 40 to 43 MT consumed each year. The northeastern states of Meghalaya and Sikkim were marked as ‘Organic States’ in the response provided in the parliament.
Bio-pesticides usage is on the rise with Maharashtra being highest consumer
The government is promoting the use of bio-pesticides through various schemes. However, the increase in consumption has not been dramatic. The consumption of bio-pesticides at the national level stood at 8,847 MT in 2019-20 as against 6,148 MT in 2015-16. Though there has been a continuous increase in biopesticide consumption, the quantity is still very less compared to conventional chemical pesticides.
Data shows that Maharashtra was the major consumer of bio-pesticides during the last five years. But the state’s consumption has declined since 2016-17. It had consumed 1,454 MT in 2016-17 accounting for one-fifth of the consumption at the national level. However, consumption came down to 1,082 MT in 2019-20, accounting for 12% of the total national consumption. Other major consumers of biopesticides are West Bengal, Tamil Nadu, Kerala, and Chhattisgarh. Rajasthan, reported an almost 100 times increase in the consumption of biopesticides in 2019-20, as compared to the previous years. The annual consumption was below 15 MT between 2015-16 to 2018-19 and jumped to 929 MT in 2019-20.


