#WaterUseEfficiency #CropGrowth #AgriculturalWaterManagement #WaterScarcity #IrrigationTechniques #SustainableAgriculture
This article presents a comparative analysis of total crop water use in three hypothetical scenarios in different regions of Australia, namely South Australia (SA), Tasmania, and Queensland (QLD). The study focuses on optimizing water use efficiency during crop growth and analyzes the consequences of such development. The data from Table 3-6 illustrates the total crop water use for a 16-week crop planted on the 1st of October 2020 and reaching maturity in each region. The calculations were based on regionally relevant weather data, including evapotranspiration (ETO) and rainfall, as well as standard crop factors (KC). The study highlights distinct climatic differences among the three regions, with varying seasonal ETO values ranging from 470 to 740 mm. Moreover, the article predicts crop water use (ETC) using specific crop factors through growth stages, revealing significant variations in water requirements for crop cultivation between SA Mallee and Tasmania.
The research conducted in this study involved analyzing total crop water use for three different regions, namely SA, Tasmania, and QLD. The crop used for the analysis was assumed to be planted on the 1st of October 2020 and matured 16 weeks later. To determine water use, data on evapotranspiration (ETO) and rainfall was collected from regionally relevant Bureau of Meteorology (BOM) stations for each growth stage of the crop.
The calculation of crop water use (ETC) involved using standard crop factors (KC) relevant to each region. These factors are essential in converting ETO and rainfall data into crop water requirements. By subtracting the rainfall amount from ETC, the water deficit for each region was established, providing insights into the potential need for irrigation to meet crop water demands.

The results of the study showed notable climatic differences across the three regions. Seasonal ETO values ranged from 470 to 740 mm during the same time period, indicating variations in water availability and potential crop water requirements. This disparity in climatic conditions between regions is crucial in understanding how different areas cope with crop cultivation and water resource management.
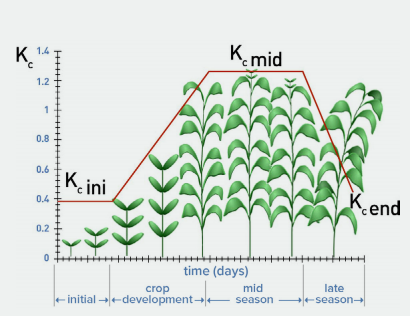
Furthermore, the study predicted crop water use (ETC) using specific crop factors (0.4, 0.7, 1.2, 1.2, and 0.7) during different growth stages (1 to 5). The analysis highlighted significant differences in water requirements between SA Mallee and Tasmania. Specifically, it was found that an additional 255 mm of water would be required to grow a 16-week crop in the SA Mallee compared to one cultivated in Tasmania.
The findings of this study have significant implications for agriculture and water resource management in the regions under analysis. Understanding the distinct climatic differences and their impact on crop water requirements is crucial for farmers and policymakers. It can aid in the optimization of water use efficiency during crop growth, ensuring sustainable agricultural practices and responsible water allocation.
The identification of regions with higher water deficits, such as SA Mallee, highlights the need for improved water conservation practices and advanced irrigation techniques to support crop production adequately. Implementing efficient irrigation systems, rainwater harvesting, and water recycling can help mitigate water scarcity and promote more sustainable agricultural practices.
| Growth stage | GS 1 | GS 2 | GS 3 | GS 4 | GS 5 | |
| mid | late | |||||
| Crop Factor (Kc) | 0.4 to | 0.7 to | 1.05 to | 1.05 to | 0.85 to | 0.7 to |
| 0.5 | 0.8 | 1.2 | 1.2 | 0.95 | 0.75 | |
Crop water use (CWU) for three hypothetical crops grown in major production regions in South Australia, Tasmania and Queensland, planted on 1 October 2020 and harvested 16 weeks later. Information in the tables include the growth stage (GS), days post planting (DPP), reference crop evapo-transpiration (ETO in mm), crop factor (KC), crop water use (ETC in mm), rainfall received in the period (mm) and the estimated water deficit (mm) that should be met with irrigation.
SOUTH AUSTRALIAN MALLEE
ETO from Loxton Research Centre – BOM station number 024024
| Date | GS | DPP | ET0 | KC | ETC | Rainfall | Deficit (ETC – Rain) |
| 1/10/2020 | 1 | 0-21 | 96.6 | 0.4 | 38.6 | 27.4 | 11.2 |
| 15/10/2020 | 2 | 22-35 | 66.6 | 0.7 | 46.6 | 10.8 | 35.8 |
| 5/11/2020 | 3 | 36-63 | 206.2 | 1.2 | 247.4 | 12.8 | 234.6 |
| 3/12/2020 | 4 | 64-91 | 208.4 | 1.2 | 250.1 | 7.0 | 243.1 |
| 31/12/2020 | 5 | 92-112 | 160.4 | 0.7 | 112.3 | 0.8 | 111.5 |
| Total | 738.2 | – | 695.1 | 58.8 | 636.3 |
| NORTHERN TASMANIA ETO from Cressy Research Station – BOM station number 091306 | |||||||
| Date | GS | DPP | ET0 | KC | ETC | Rainfall | Deficit (ETC – Rain) |
| 1/10/2020 | 1 | 0-21 | 58.6 | 0.4 | 23.4 | 87.4 | 0 |
| 15/10/2020 | 2 | 22-35 | 48.0 | 0.7 | 33.6 | 6.0 | 27.6 |
| 5/11/2020 | 3 | 36-63 | 125.0 | 1.2 | 150.0 | 22.4 | 127.6 |
| 3/12/2020 | 4 | 64-91 | 130.8 | 1.2 | 157.0 | 72.2 | 84.8 |
| 31/12/2020 | 5 | 92-112 | 109.7 | 0.7 | 76.8 | 23.6 | 53.2 |
| Total | 472.1 | – | 440.8 | 211.6 | 293.2 | ||
LOCKYER VALLEY – QUEENSLAND
ETO from University of Queensland Gatton – BOM station number 040082
| Date | GS | DPP | ET0 | KC | ETC | Rainfall | Deficit (ETC – Rain) |
| 1/10/2020 | 1 | 0-21 | 122.2 | 0.4 | 48.9 | 3.0 | 45.9 |
| 15/10/2020 | 2 | 22-35 | 71.0 | 0.7 | 49.7 | 84.6 | 0 |
| 5/11/2020 | 3 | 36-63 | 203.8 | 1.2 | 244.6 | 0.8 | 243.8 |
| 3/12/2020 | 4 | 64-91 | 169.8 | 1.2 | 203.8 | 46.0 | 157.8 |
| 31/12/2020 | 5 | 92-112 | 119.6 | 0.7 | 83.7 | 85.8 | 0 |
| Total | 686.4 | – | 630.6 | 220.2 | 447.4 |
On the other hand, regions with lower water deficits, like Tasmania, can benefit from the knowledge of their relatively lower water demands for crop cultivation. This insight can lead to informed decision-making regarding water allocation and usage, which may further boost agricultural productivity and reduce unnecessary water consumption.
This comparative study on total crop water use in SA, Tasmania, and QLD underscores the importance of considering regional climatic variations and crop-specific water requirements in agricultural planning. By optimizing water use efficiency and adopting sustainable water management strategies, Australia’s agricultural sector can navigate water challenges, enhance productivity, and contribute to overall environmental conservation.
Source: Australian Potato Growers


