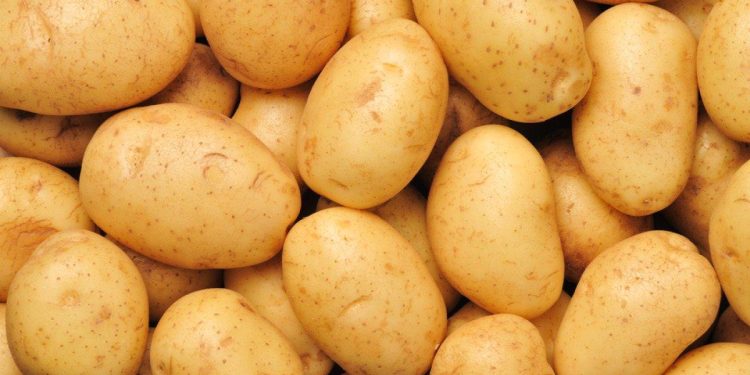
Potato is a predominant vegetable in India. At present most of the domestic supply of potatoes is consumed as fresh (68%) followed by processing (7.5%) and seed (8.5%). The rest 16% potatoes are wasted due to post harvest losses. However, the proportion of potato used/ wasted due to various reasons is expected to change in the medium and long term scenario.
Fresh Potatoes
Per capita consumption of fresh potatoes (FAOSTAT) increased from 1991 to 2010 at an ACGR of 2.34. Will this consumption rise in the future at the same rate? The stagnating growth rates of cereals’ productivity, large scale diversion of food grains to feed & bio-fuel and expected steep rise in per capita consumption of pulses, edible oil, fruits, vegetables, milk, sugar and non-vegetarian food in the regime of steadily rising population is bound to put pressure on existing cultivable land. Since, cultivable land is expected to remain more or less constant in the next 40 years, the role of crops like potato having higher production potential per unit land and time will become imperative. In this context potato crop has very high probability of making crucial contribution to the future national food security agenda.
The perceived changes in Indian socio-economics in the medium and long term are expected to enhance per capita food consumption of fresh potatoes. Potato is an important ingredient of most of the fast foods in organised as well as unorganised sector. Rapid urban population growth from 375 to 840 million over next 40 years at an ACGR of 2.04% is expected against the overall national ACGR of population at 0.78%. Faster rise of number of nuclear families, higher disposable incomes on account of fast economic growth resulting into higher tendency of out- of-home eating and rapid increase in the number of working women in the medium and long run are expected to maintain the overall ACGR of 2.265% in per capita consumption of fresh potatoes. Per capita food demand of fresh potatoes at this ACGR will be 48.5 kg in the long term (Table 1). The corresponding national food demand for fresh potatoes will be 78.5 million t in 2050.
Processing Quality Potatoes
Table 1 Per capita and total national food demand for fresh potatoes
| Items | 2010 | 2020 | 2030 | 2040 | 2050 |
| Per capita fresh (kg) | 19.78 | 23.70 | 29.16 | 37.12 | 48.47 |
| National demand (million t) | 23.94 | 30.84 | 40.82 | 55.89 | 78.47 |
Agri-processing sector experiences very fast growth rate when an economy transforms from developing to developed economy. The rise of Indian economy from $ 1.57 to between 13 and 34 trillion (under varied scenarios; NCAP estimates) is not possible without corresponding rise in agri-processing industry. Further, potato is always the front-runner when we take processing of agri-commodities into consideration. Analysis of past experience and pattern of Indian processing industry suggests that demand for processing quality potatoes over next 40 years will rise at the fastest pace for French fries (11.6% ACGR) followed by potato flakes/powder (7.6%) and potato chips (4.5%). The actual demand for processing potatoes will rise from 2.8 million t in 2010 to 25 million t during the year 2050 at an ACGR of 5.61% (Table 2).
Table 2 Raw material demand of potato processing industry (million t)
| Product(s) | 2010 | 2020 | 2030 | 2040 | 2050 |
| Potato chips | 2.45 | 5.59 | 9.09 | 12.06 | 14.22 |
| Potato flakes/powder | 0.29 | 0.89 | 1.99 | 3.58 | 5.44 |
| Frozen potato products | 0.06 | 0.30 | 1.03 | 2.64 | 5.40 |
| Total | 2.80 | 6.78 | 12.11 | 18.28 | 25.06 |
Potato starch making industry doesn’t exist in India and its future is difficult to predict on account of short duration domestic potato cultivation, unknown future developments in potato starch industry of China and European Union (predominant global players) and possible allocation of more and more cultivable land to food security options rather than industrial products. However, if some quantity of potatoes is used for making potato starch or other industrial products, then this demand is not quantified and will be over and above the estimated one.
The corresponding total and per capita demand of actual processed potato products at current level and in the future is depicted in table 3. The total demand of processed potato products is estimated to rise from 0.7 million t in 2010 to 7.3 million t in 2050. The corresponding per capita demand for processed potato products will increase from 0.6 to 4.5 kg (6.03% ACGR) over the period of 40 years.
Seed Potatoes
Table 3 Demand of potato products (thousand t)
| Potato Chips | Potato flakes/ powder | Potato flakes/ powder | Total | ||
| 2010 | Thousand t | 612 | 52 | 34 | 698 |
| Per capita g | 506 | 43 | 28 | 577 | |
| 2020 | Thousand t | 1398 | 160 | 168 | 1726 |
| Per capita g | 1080 | 124 | 130 | 1334 | |
| 2030 | Thousand t | 2273 | 358 | 556 | 3187 |
| Per capita g | 1630 | 257 | 399 | 2286 | |
| 2040 | Thousand t | 3015 | 644 | 1412 | 5071 |
| Per capita g | 2007 | 429 | 940 | 3376 | |
| 2050 | Thousand t | 3555 | 979 | 2808 | 7342 |
| Per capita g | 2194 | 604 | 1733 | 4532 |
As per FAOSTAT, India used 2.96 million t potato tubers (8.5% of national potato production) as seed during triennium ending year 2010. The absolute quantity of potatoes used as seed is estimated to increase to 6.1 million t during 2050. However the proportion of tubers used as seed will fall to 5% of national potato production during 2050, on account of anticipated higher potato productivity.
Post-harvest Losses
At present a higher proportion of potatoes (16%) is wasted as post-harvest losses (PHLs) than that used as seed (8.5%) or processing (7.5%). This is an unfortunate situation that nearly 1 million t in excess to the total potato production in Canada during the triennium ending 2010 (FAOSTAT) was wasted in India. Although, due to hot summer temperatures, lack of state of the art cold storage facilities and massive transportation of potatoes from northern to southern states are the causes of the high wastage of potato in absolute terms, the proportion of PHLs to the total potato production in the country are targeted to be lower. The estimated PHLs are targeted to lower from the current 15.75 to 10% in the year 2050, while the corresponding quantity of PHLs is estimated at about 5.5 (current), and 12 million t (in 2050).
Export
Net annual average of Indian potato export over previous decade has more or less stagnated at 0.1 million t. Potato being semi-perishable and bulky agri-commodity, its export from India is not guided by a long term policy support. As potato is a politically sensitive crop, targeted steps are taken to keep its retail prices at affordable level for the ordinary consumer. Export is generally a crisis management tool during the years of oversupply. However, in international markets exports can only be increased through building credibility and making long term contracts. It is anticipated that the future food policy will concentrate more and more on ensuring national food security and low value export of agri-commodities may be discouraged. Under these circumstances steep rise in export of fresh potatoes from the country is unlikely. India being the massive producer of potatoes a healthy growth in processed potato products is anticipated. However, unknown and complex future developments at international level are difficult to be assessed. Moreover, in the absence of a clear cut support through a robust export policy it is not possible to estimate and assign future targets for the export of processed potato products.
Other Uses
Currently we don’t feed potatoes to animals hence no estimate can be generated on this use in the future. However, if some quantity of potatoes is used as animal feed then it would be over and above the estimated overall demand.
Total Potato Demand
The demand for potatoes in India is estimated to rise to 122 million t in the year 2050. Demand for processing quality potatoes will rise at the highest rate and their proportion in the net domestic supply will rise from 7.5% in the triennium ending 2010 average to 20.5% in 2050 (Table 4). Considering net domestic supply the proportion of potatoes
Table 4 Component wise potato demand (million t)
| Year | Demand$ | Fresh | Processing | Seed | Waste |
| 2010 | 35.23 | 23.94 | 2.8 | 2.96 | 5.53 |
| (100 | (68.21 | (7.61 | (8.43 | (15.75 | |
| 2020 | 47.91 | 30.84 | 6.78 | 3.55 | 6.74 |
| (100 | (64.37 | (14.15 | (7.41 | (14.07 | |
| 2030 | 65.39 | 40.82 | 12.11 | 4.25 | 8.21 |
| (100 | (62.43 | (18.52 | (6.5 | (12.56 | |
| 2040 | 89.26 | 55.89 | 18.28 | 5.09 | 10 |
| (100 | (62.61 | (20.48 | (5.7 | (11.2 | |
| 2050 | 121.81 | 78.47 | 25.06 | 6.1 | 12.18 |
| (100 | (64.42 | (20.57 | (5.01 | (10 |
Note: Figures in parenthesis are percentages; $: net domestic demand put to seed and wastage due to post-harvest losses will gradually decrease in future. Sharp increase in potato utilization for processing purpose will slightly lower down the proportion of fresh potato consumption as food by 2050.


