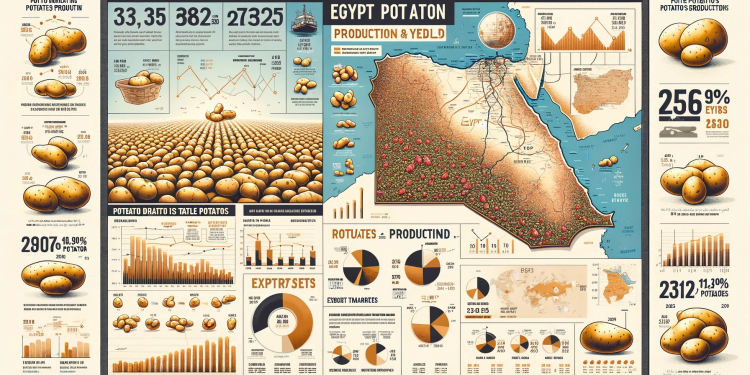
Egypt has experienced significant growth in potato production between 2010 and 2020, with harvested areas increasing by twofold (from 141,000 to 276,000 hectares) and production rising from 3.6 to 6.8 million tons. However, in 2021 and 2022, there was a decline in both harvested areas (by 25%, down to 213,000 hectares) and production (by 10%, to 6.2 million tons). By 2021, the yield per hectare reached 30 tons.
Egypt is now one of the largest exporters of potatoes and potato-based products globally. In 2022, it ranked 5th in the world for the export of table potatoes, with 945,000 tons shipped—almost double the amount from 2019 (550,000 tons). The largest importer of Egyptian table potatoes is Russia, which in 2022 imported 363,000 tons, accounting for 40% of total exports. Other major buyers include several EU countries such as Greece, Italy, Spain, Slovenia, Germany, and Belgium.
In 2023, Egypt’s table potato exports dropped to 588,000 tons, with all importing countries, including Russia, reducing their purchases (to 107,000 tons).
Egypt also saw significant growth in the export of seed potatoes, ranking 5th in the world in 2023 with 90,000 tons exported. The largest customer for Egyptian seed potatoes is Russia, which imported 33,000 tons. At the same time, Egypt is a major importer of seed potatoes, with imports reaching 152,000 tons in 2023. The main suppliers are the United Kingdom, Netherlands, and France.
The export of frozen French fries from Egypt has rapidly increased, doubling from 51,000 tons in 2020 to 99,000 tons in 2023. Key buyers in 2023 include the USA, UAE, Saudi Arabia, and Jordan. Egypt ranked 11th globally for frozen French fry exports in 2023.
Additionally, Egypt has seen a rise in exports of potato chips. From 2020 to 2023, sales grew from 6.4 to 11.5 thousand tons. The main importers of Egyptian potato chips are Palestine, Libya, and Jordan.
Table 1. Potato Production in Egypt
| Year | Harvested Area (000 ha) | Potato Production (000 t) | Yield (t/ha) |
|---|---|---|---|
| 2010 | 141 | 3,643 | 26 |
| 2015 | 184 | 4,955 | 27 |
| 2020 | 276 | 6,786 | 25 |
| 2021 | 211 | 6,274 | 30 |
| 2022 | 213 | 6,155 | 29 |
| Source: FAOSTAT |
Table 2. Egypt: Export of Table Potatoes 2019-2023 (000 tons, HS code – 070190)
| Year | World | Russian Federation | Greece | Iraq | Italy | Spain | UAE | Slovenia | Lebanon | Netherlands | Germany | Kuwait | Belgium | Saudi Arabia | Oman |
|---|---|---|---|---|---|---|---|---|---|---|---|---|---|---|---|
| 2019 | 549.5 | 105.7 | 95.2 | 15.9 | 50.4 | 1.5 | 20.7 | 27.3 | 52.5 | 6.5 | 27.6 | 7.1 | 15.8 | 1.4 | 4.4 |
| 2020 | 591.8 | 150.0 | 76.1 | 29.6 | 39.2 | 5.2 | 53.2 | 27.6 | 38.2 | 5.8 | 40.6 | 18.1 | 21.2 | 7.2 | 23.6 |
| 2021 | 477.0 | 195.4 | 47.1 | 19.4 | 33.7 | 7.0 | 28.9 | 18.5 | 20.0 | 4.7 | 27.0 | 8.9 | 13.9 | 5.2 | 13.0 |
| 2022 | 945.5 | 363.2 | 93.1 | 59.6 | 44.5 | 9.8 | 57.5 | 24.9 | 60.2 | 21.9 | 42.1 | 23.9 | 16.0 | 9.9 | 21.6 |
| 2023 | 588.4 | 106.9 | 74.0 | 51.1 | 47.6 | 32.8 | 32.7 | 32.0 | 27.9 | 18.6 | 18.5 | 15.3 | 13.8 | 13.1 | 12.1 |
| Source: Trade Map |
Table 3. Egypt: Export of Seed Potatoes 2019-2023 (tons, HS code – 070110)
| Year | World | Russian Federation | Italy | Greece | UAE | Netherlands | Spain | Belgium | Turkey | Slovenia |
|---|---|---|---|---|---|---|---|---|---|---|
| 2019 | 9,575 | 4,954 | 781 | 333 | 210 | 201 | 175 | 129 | 129 | |
| 2020 | 8,957 | 3,373 | 742 | 21 | 381 | 20 | 77 | 64 | 566 | |
| 2021 | 8,107 | 5,252 | 178 | 301 | 616 | 69 | 277 | |||
| 2022 | 7,884 | 3,097 | 43 | 293 | 1,924 | 104 | 3,050 | 48 | ||
| 2023 | 90,427 | 32,716 | 12,178 | 9,730 | 4,821 | 4,089 | 3,532 | 2,493 | 2,452 | |
| Source: Trade Map |
Table 4. Egypt: Import of Seed Potatoes 2020-2023 (000 tons, HS code – 070110)
| Year | World | United Kingdom | Netherlands | France | Denmark | Germany | China | Belgium |
|---|---|---|---|---|---|---|---|---|
| 2020 | 113.7 | 40.3 | 35.2 | 19.5 | 6.8 | 3.9 | 2.4 | 3.4 |
| 2021 | 155.9 | 49.9 | 57.8 | 26.4 | 8.7 | 5.0 | 1.9 | 3.1 |
| 2022 | 176.3 | 72.0 | 54.6 | 19.2 | 10.9 | 9.4 | 2.6 | 3.6 |
| 2023 | 152.4 | 67.8 | 38.8 | 18.5 | 9.1 | 7.9 | 2.7 | 2.7 |
| Source: Trade Map |
Table 5. Egypt: Export of Frozen French Fries 2019-2023 (000 tons, HS code – 200410)
| Year | World | USA | UAE | Saudi Arabia | Jordan | Kuwait | Brazil | Morocco | Bahrain | Oman | Libya | Qatar |
|---|---|---|---|---|---|---|---|---|---|---|---|---|
| 2019 | 73.0 | 17.8 | 9.0 | 13.5 | 10.1 | 4.6 | 2.4 | 1.8 | ||||
| 2020 | 51.2 | 17.5 | 8.0 | 7.3 | 6.9 | 2.8 | 1.8 | 1.6 | ||||
| 2021 | 67.1 | 20.4 | 14.9 | 7.5 | 9.5 | 3.6 | 2.2 | 2.3 |


