The system uses satellite images alongside artificial intelligence and has already been successfully tested to anticipate potato performance.
Researchers from the Remote Sensing Laboratory (LATUV) of the University of Valladolid (UVa) have designed a new vegetation index capable of improving crop prediction models. The new technique, which uses ESA Sentinel-2 satellite images and machine learning and artificial intelligence techniques, has been successfully tested in predicting potato and wheat crop yield.
Agricultural production depends on a large number of factors, both human and environmental, that create great uncertainty among farmers. But technology can be an important ally in reducing it. This is the case for computational models that seek to simulate the behaviour of a crop under specific conditions, for example soil, climate or agricultural practices, and, depending on this expected evolution, estimate agricultural production.
“There are many models and they are usually specific to each type of crop,” explains Diego Gómez, a LATUV researcher and first author of two recently published studies in the journals International Journal of Remote Sensing and Agricultural and Forest Meteorology.
But these traditional growth models have some limitations, such as “the inability to spatially model variability within the same parcel” or the multitude of input data they require that “are not usually obtained due to the high cost of time and money involved in collecting them.”

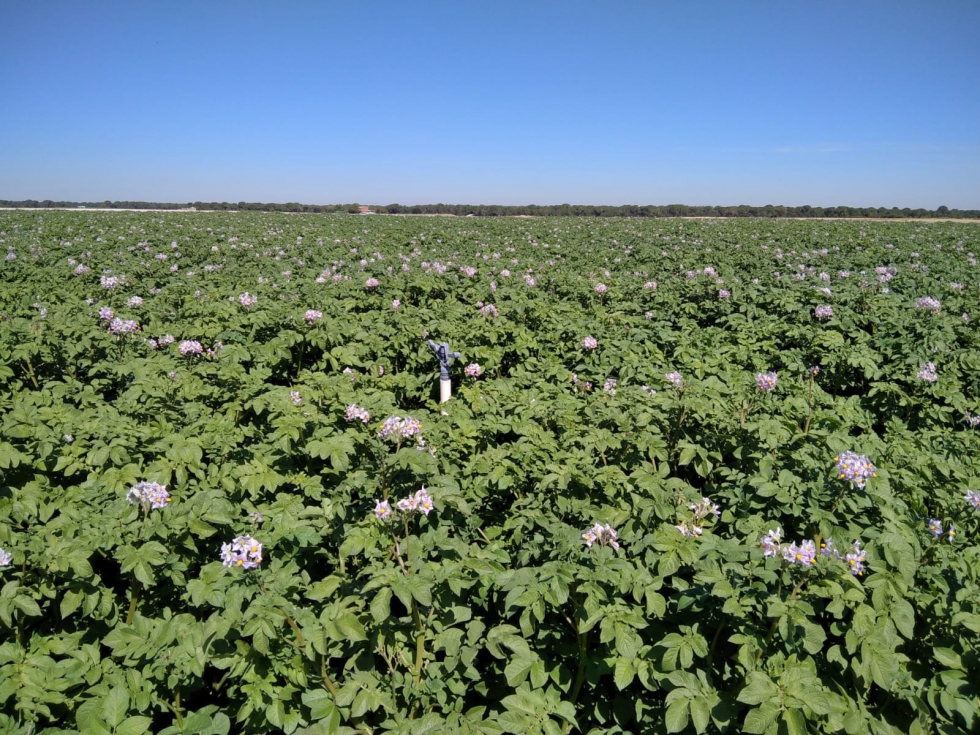
Potato growing area on which the estimates have been made/D. Gómez
Thus, in recent years we are betting on a technology, remote sensing, that uses spectral images taken by optical sensors (installed on satellites, airplanes, drones, etc.) and that can complement and even replace in some cases these traditional models. These spectral images provide data on the state or phenology of the crop – the visible external changes in the plant development process – that are integrated into models that adjust that input information to predict crops.
“Spectral images cover that need for input data, allow access to remote sites, and have a low cost. They are also able to obtain information that is related to the productive capacity of the crop,” notes the LATUV researcher, who recalls that one of the spectral indices – mathematical formulas that combine spectral bands – of vegetation most commonly used to estimate the vigorosity or density of vegetation – which ultimately predicts crop productivity – is the NDVI (NDVI).
The use of time series of this index to generate predictive models of crops is very common in the scientific literature. This index uses vegetation reflectance – the vegetation’s ability to reflect light – in two spectral bands, red and near-red, which are related to some of the light used for photosynthesis and the cell structure of the leaves, respectively.
A new vegetation index
LATUV researchers have developed a new index called PPI based on ESA Sentinel-2 satellite images that, in addition to taking into account the spectral information involved in photosynthesis – 400 to 700 nanometers – takes into account information from other areas of the electromagnetic spectrum -704 nanometers, Red Edge band and 945 nanometers, water vapour absorption band- , which can provide other key information about the state of the crop, such as its water stress – when the plant demands more water than it has.
Researchers compared the predictive capacity of both vegetation indices, NDVI and PPI, along with more data from satellite images. To do this, they used two Artificial Intelligence and Machine Learning algorithms (called Random Forest and Support Vector Machine), and generated various models in which they combined these indexes with the other satellite bands.
“The hypothesis was that, by using an index that uses other bands not included in the popular NDVI index and, on the other hand, with some potential to provide sensitive crop information, the predictive models would be better,” says Gómez, who advances that, finally, the predictive capacity of the models “increased when either or both vegetation indices were included” , which values “the use of this data in combination with certain individual satellite bands”.
More accurate predictions in potato cultivation
The results show that the PPI index provides information similar to NDVI when using the Support Vector Machine algorithm, and is significantly more informative than NDVI when using the Random Forest algorithm, promising results “that put on the table a new vegetation index that can improve predictive harvest models based on satellite images”.
So far, the new index has been tested on potato cultivation in a fairly localized study area. After cereal, potato is one of the most important food crops globally. It plays a key role in the food security of developing countries and also has great weight in the European agricultural sector, with Germany, France, the Netherlands and Poland as major producers. It has also been tested in wheat with data taken in Mexico.
The idea of the equipment is to increase the number of data to improve the solidity of the model, cover a larger study area to increase spatial variability and incorporate new crops. Perspectives that depend on continuity of funding and can help farmers predict their harvest more reliably in the future.


